
Stop Losing Money to
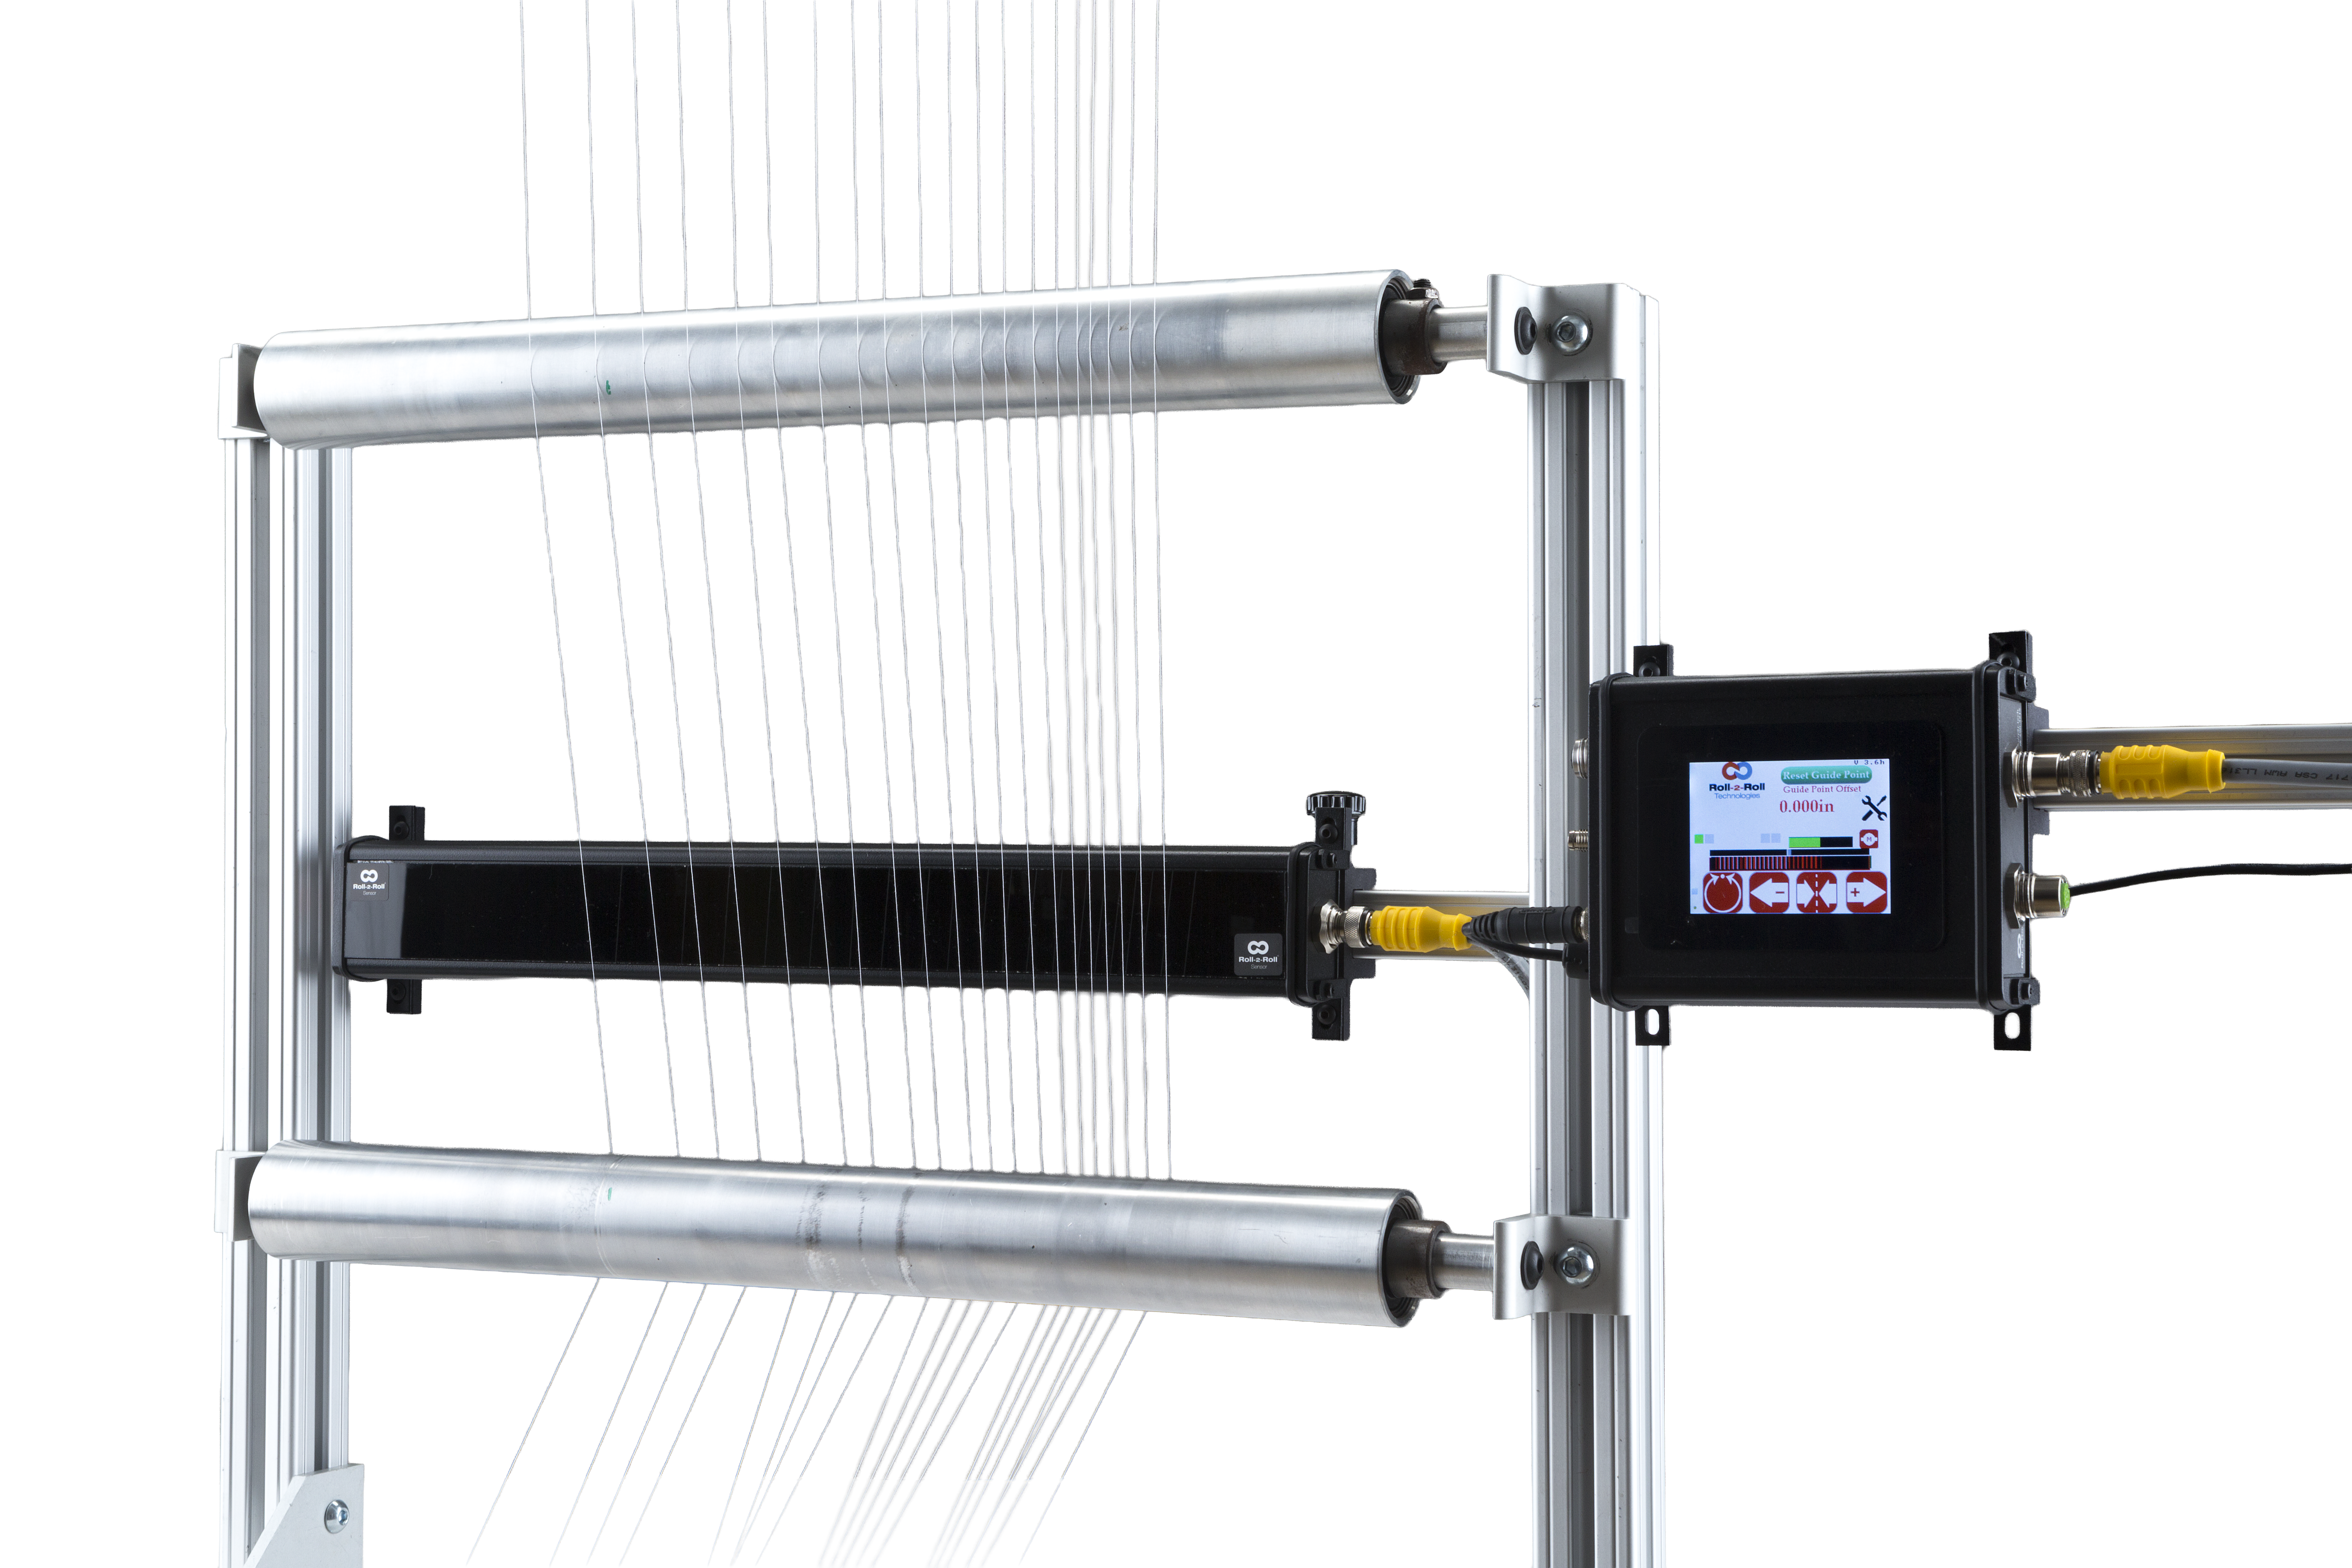
Your legacy sensors are costing you thousands monthly in hidden waste, downtime, and labor. Patented fiber-optic technology eliminates that — no calibration, no complexity, and more insight into your process.
$14,200/year avg. savings with Roll-2-Roll® Sensors
Trusted by 1,000+ installations across 25+ countries


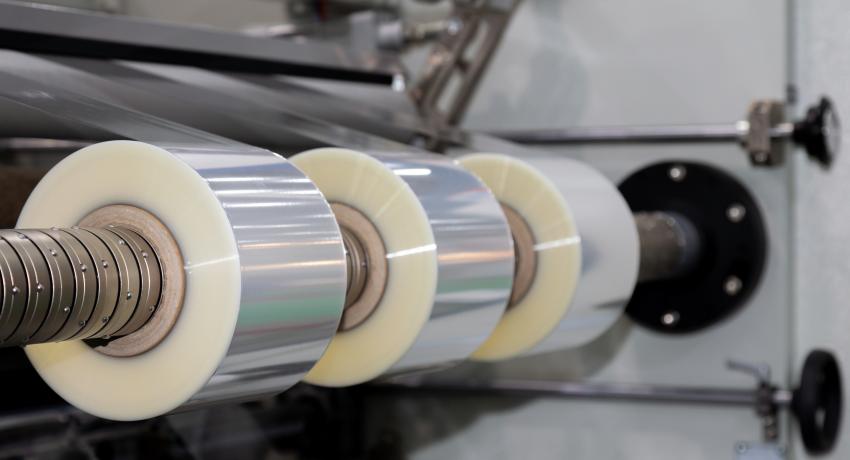
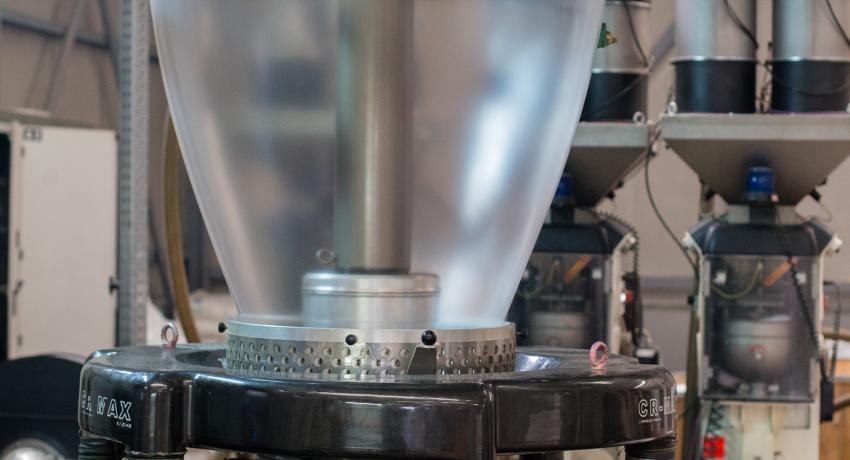
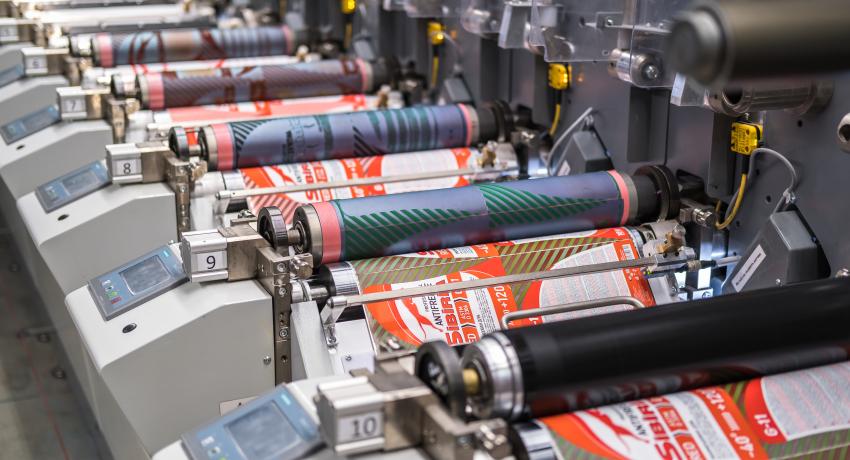
The Diverse Industries We Serve
See how Roll-2-Roll works in your industry


What Is Your Legacy System Really Costing You?
Calculate the hidden costs your current web handling equipment adds to every roll.
Every time an operator physically moves a sensor for a new web width, your line stops. Sensors are often mounted below eye level or above reach height, forcing operators to bend into machine frames or climb ladders near moving rollers. Machines with guard doors require additional lockout/tagout time. Some operators skip this and reposition sensors while the line is running — an extremely dangerous shortcut. With legacy fixed-mount sensors, each changeover also generates startup scrap before alignment is verified. Industry data shows converting lines lose 5–15 minutes per sensor repositioning stop, with downtime costing $1,000–$200,000/hr depending on application.
Sources: Siemens True Cost of Downtime 2024, BLS Occupational Injury Data, FTA Flexographic Benchmarks, Liberty Mutual Workplace Safety Index 2025
Your Operation
Startup Scrap
Calibration & Maintenance
Operator Errors
Web Break from Repositioning Error
Safety & Liability Risk
Without real-time width measurement, deviations go undetected until material is already scrapped or downgraded. It is difficult for operators to notice even 25mm of width change on a 2.5m wide roll, and impractical to measure wound rolls manually due to safety hazards. Manual spot-checks miss events between measurements, excessive trim goes undetected, and customer rejections come as costly surprises. Select your application type below — each has unique cost drivers.
Sources: PFFC Industry Benchmarks, FTA Flexographic Standards, TAPPI Converting Guidelines
Undetected Deviation Scrap
Manual Measurement Labor
Customer Rejections
Excess Trim Waste
Downtime for Width Corrections
Reduced Line Speed
Safety Risk (Manual Measurement)
Excess Trim Waste
Blade Position Errors
Edge Quality & Customer Rejections
Changeover Downtime
Reduced Line Speed
Bubble Instability Losses
Downgraded & Rejected Rolls
Fold-Related Rejects
Lost Capacity (Speed Reduction)
Necking Material Loss
Coating Mismatch Rework
Web Break Downtime
Pneumatic and hydraulic actuators carry hidden operational costs that electric actuators eliminate entirely. Compressed air is the most expensive utility in a manufacturing plant — with overall system efficiency as low as 10–15% (DOE). Hydraulic systems waste up to 60% of input energy running pumps continuously, add oil spill liability, and require costly servo valve calibration. Select your actuator type below to calculate the true annual cost.
Sources: U.S. DOE Compressed Air Challenge, British Fluid Power Association, Tolomatic TCO Study, Machinery Lubrication, OSHA Safety Data, Liberty Mutual Workplace Safety Index
Compressed Air Energy
Air Leak Waste
Maintenance & Parts
Positioning Accuracy Scrap
Failure Downtime
Speed Limitation Waste
Moisture & Contamination Damage
HPU Continuous Energy (Pump Runs Non-Stop)
Oil Purchase, Replacement & Disposal
Oil Leak & Spill Cleanup
Slip & Fall Liability (Oil on Floor)
Environmental Compliance
Servo/Proportional Valve Tuning
Hose & Seal Replacement
Asymmetric Extend/Retract Speed Scrap
Catastrophic Failure Downtime
Legacy web handling systems from discontinued product lines bleed money in ways that don’t show up on a single line item. Obsolete parts carry 150%+ markups on the secondary market. Technicians waste hours searching for discontinued components. Inventory carrying costs run 20–30% of stock value annually — and much of that inventory may never be used. Each year of deferral increases the eventual retrofit cost through rush engineering and unplanned downtime. Meanwhile, aging equipment is the #1 cause of unplanned downtime (42–50% of all incidents), and retiring workers take irreplaceable tribal knowledge with them. This calculator quantifies the hidden cost categories so you can see the true annual premium of “just keeping it running.”
Estimates based on industry benchmarks (Siemens, DOE, BLS). Typical results — actual savings vary by application.